
How to test Battery Capacity, Battery Amps-hours, mAh, Watt-hours?
The article describes capacity-hours, amp-hours, mAh, watt-hours, internal or series resistance, temperature effects, battery cutoff voltages, and characteristic curves of D/C batteries. Precisely the battery capacity.
The figure is very nominal; it’s borderline, so what is the capacity? A battery can supply a constant current or a constant amount of energy into a load for a given amount of time, simple as that, so how do you characterise battery capacity? Well, you can do it in two different ways.
Different Ways to calculate Battery’s Capacity
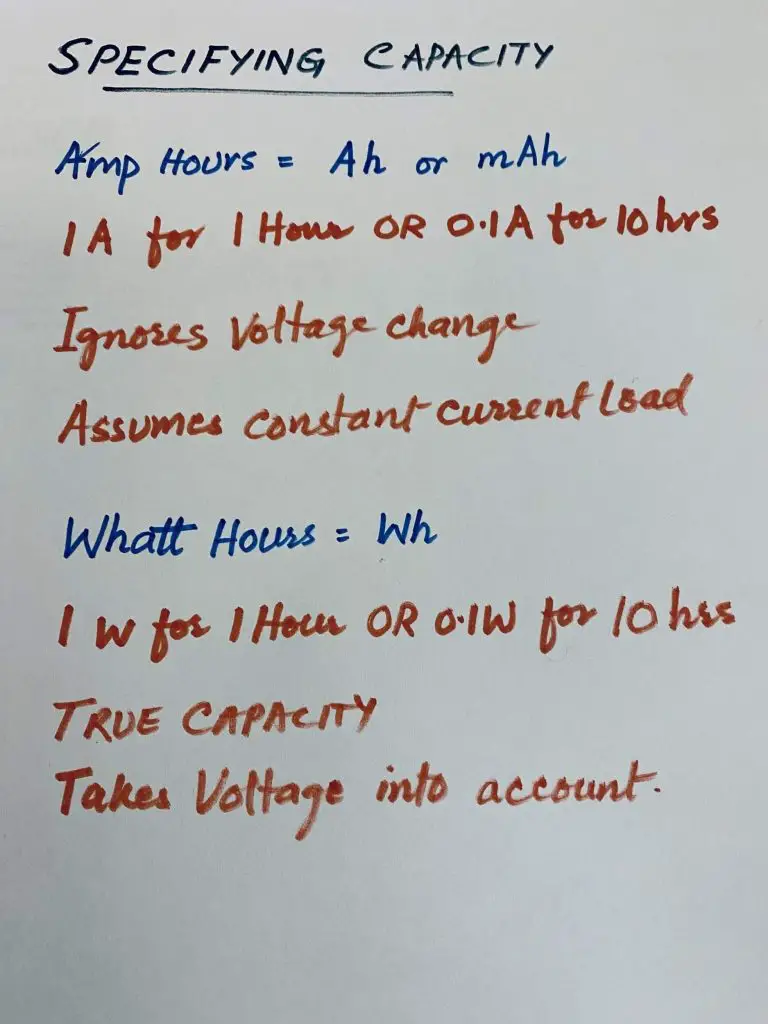
There are two ways to specify it; The first way and probably the most common is; air powers or milliamp-hours that establish an H or mAH. This is not strictly the correct way to specify battery capacity because it makes some assumptions. It assumes that it ignores the voltage change in the battery, and it takes that you’ve got a constant current load and not all loads are like that which we’ll go into, the capacity; let’s say the battery is rated for one air power here, that means it can deliver (one amp for one hour) or it can deliver 0.1 amps for 10 hours and so forth.
As you go further and you drop in current, usually, that’s the upper limit so one amp-hour battery you might be able to draw two air pals from it but the performance capacity is going to be much less.
The second way to define battery capacity is in what’s called watt-hours or Wh, and you can get milli-1 hour and stuff like that as well. same for milliamp-hours up here, now this is the only true way to measure the actual capacity of the battery. Because you measure the true amount of energy in there because it takes into account the current and the voltage.
What’s V times I Ohm’s law right, so it does not make any assumptions at all it’s the true capacity, and it’s the same thing for milliamp-hours up here if it’s specified if you have got a 1-watt hour battery, means it can deliver 1 watt for 1 hour or 0.1 watts for 10 hours and so forth, and once again, you can go higher than that an 11-hour battery you might be able to draw 2 watts for half an hour, but probably not it’s usually going to be less than that.
So measuring in milliamp-hours capacity, milliamp hours is only valid if you assume that the battery voltage is constant. Now let’s take a look at this. It all comes down to the discharge curve or the discharge characteristic curve of a battery. Now there are lots of different batteries out there that have lots of other technologies in the curves. The characteristic curves will all be different shapes, but they will all have a characteristic curve. No battery is perfect, now take the case of an ideal battery.
What is the discharge curve?
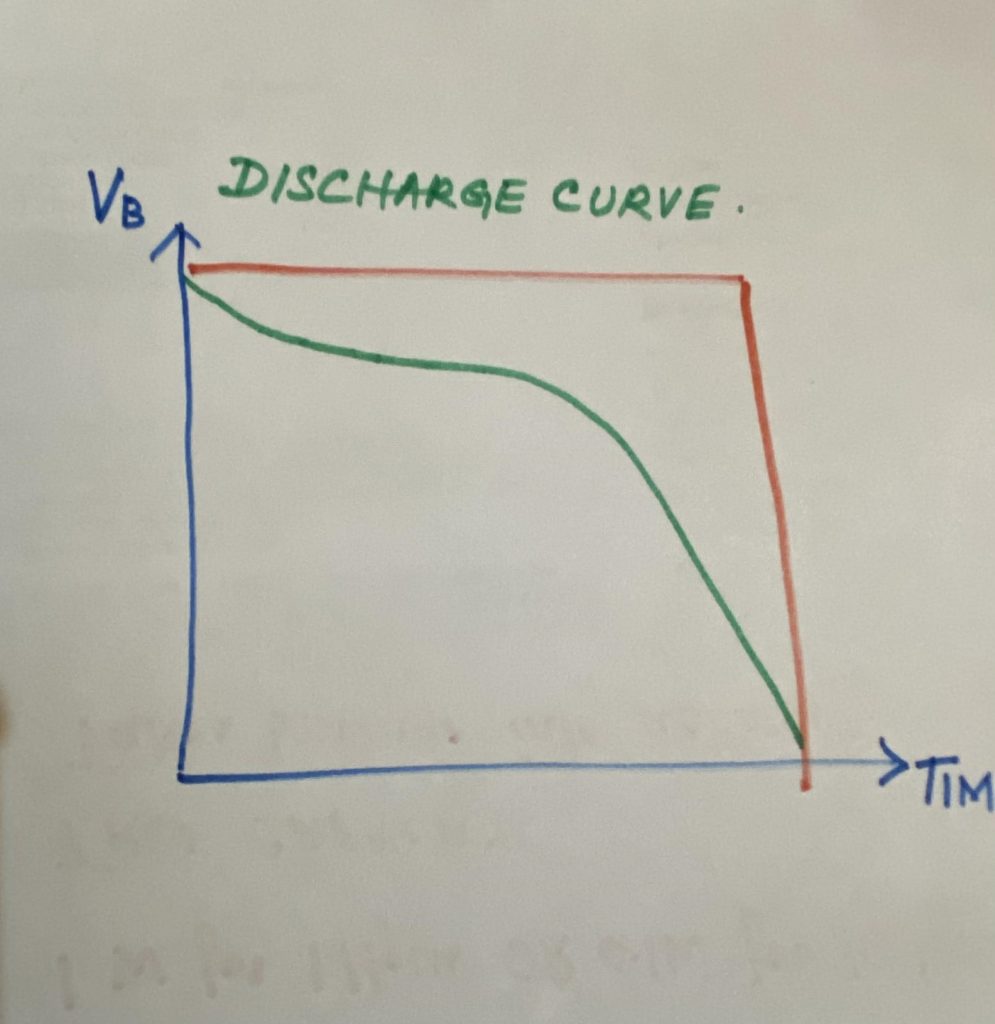
The battery voltage on the y-axis in Volt, in this case, is; 1.5 volts, AA standard single-cell alkaline cell everyone’s familiar with versus time on the x-axis. Now an ideal battery, in this case, is the one in red. It will start at 1.5 volts and it will study at 1.5 volts for all the time that you are discharging powering your product. Then suddenly the battery dies and drops straight off; that’s called a brick wall response.
The old brick wall response no battery will even ever come close to giving you that it’ll have a characteristic curve which is this green line down here and we’ll start it’s a 1.5 it will drop fairly quickly it might flatten out and go or go a bit that will just drop it at the linear rate and then curve off right at the end, and that’s the true performance now as you’ll see with this laptop battery its capacity is rated in milliamp-hours and also in watt-hours as well.
What’s the difference?
There’s not much difference in this term in this actual application because due to calculating the watt-hours, they just take a nominal voltage figure they don’t take into account; they just choose a nominal figure in the middle of the curve in the figure. Somewhere they don’t take into account the full change in voltage usually anyway, so there’s not much difference but watt-hours is technically a better way to rate battery capacity. it’s also the way that they rate the different technologies alkaline, nickel-metal hydride, lithium-ion, lithium polymer all that sort of stuff.
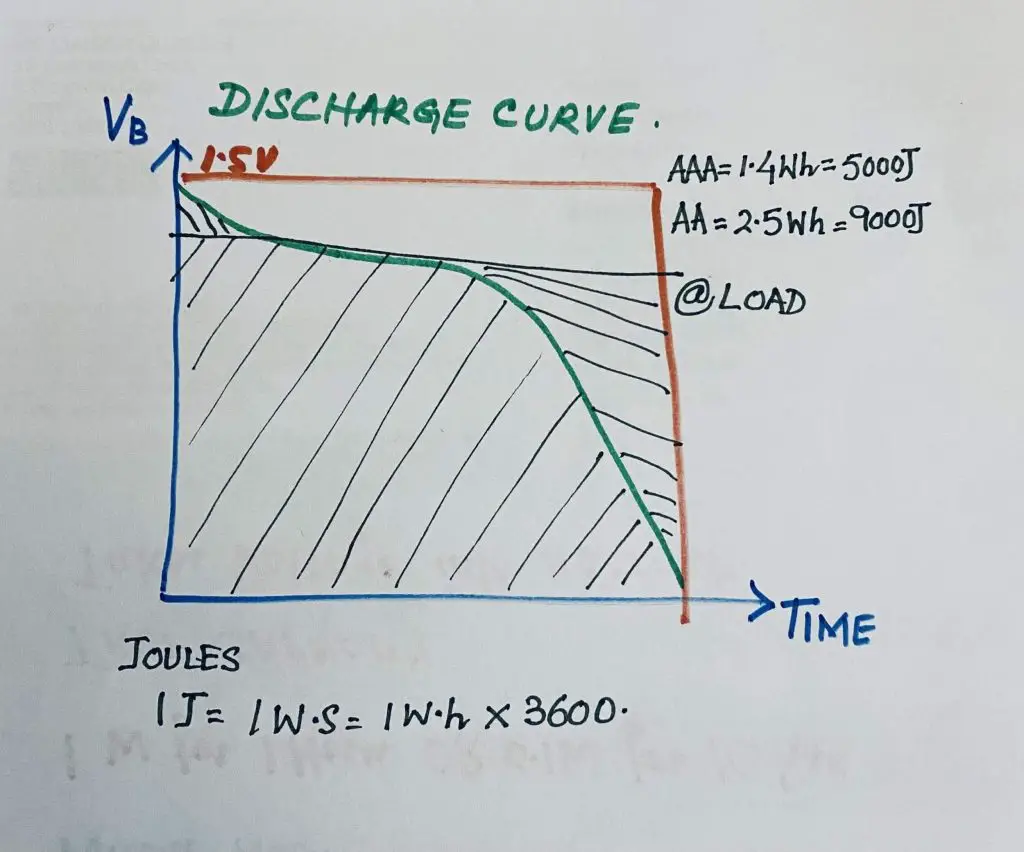
It is the capacity of those types of batteries and those battery technologies are rated in what hours per something, such as what hours per kilogram of battery material so just how much energy is in your humble AA battery or AAA battery. It might surprise you in fact, it might surprise you a lot now because we’re talking watt-hours watt out that’s energy so we can also talk joules as well.
Joules is a direct relationship, one Joule here equals one watt-second not watt-hour so to get your energy in joules you have to multiply your watt-hour in the figure by 3,600 because it’s 3,600 seconds in an hour. So if you do that and you look at a double a triple a and a double a better you triple a battery 1.4 watt-hours. It varies a lot as we’ll go into and that’s equivalent to about 5,000 odd joules, there are about two AA batteries. 2.5 watt-hours roughly or 9,000 joules.
Don’t even mention your huge D-cell battery or something like that. Other tiny little batteries now give you an idea of what many thousands of joules can do. A massive amount of energy is stored in the chemicals in these batteries, a humble AAA or AA battery, and a massive amount of energy you can extract. If you extract the energy out of this, and store it in a massive big capacitor bank, at large voltages with very low ESR, and it’s able to dump that energy, then you can well and truly blow a multimeter or something else to dust with a AAA battery. It’s amazing how you measure the capacity of the battery.
If you look at the discharge curve again, that’s the green one here. The capacity of any battery is the total area under that curve, the area under the curve is integral, so if you know how to do your integrals and you’ve got the actual data, you can do an integral of it, but we would not do that. The other easier way to do it is to log the voltage and the current from the battery for a given load. So it must be at a given load, and then you measure the voltage and the current at regular intervals. All the way along and then you can calculate from that.
The total watt-hour capacity of the battery and that’s how it’s traditionally done.
What is the difference between watt-hour capacity and amp-hour capacity?
Is there any major practical difference in practice?
The answer is not, that’s why a lot of batteries will be specified in amp-hour capacity, and their discharge will be assumed to be a constant current load. Now the reason for this is fairly simple. We have already mentioned that the true capacity of a battery is measured in watt-hours, and it’s the total area under the curve under the grand discharge curve. But if you want to make them, if you want to measure B or specify the airpower capacity of a battery then you just assume a nominal voltage like that across there.
Voltage might be 1.2 volts, for a nominal constant current load, what happens in that case when you make those assumptions you measure this area in here which you shouldn’t be okay so there’s going to be some extra capacity there. Therefore, you do not measure this one up here so they can kind of cancel each other out in terms of the area. That’s why the constant current amp-hour capacity at a certain constant current load might often be similar to the watt-hour capacity or the true capacity of the battery, so what sort of things can affect battery capacity. It turns out there’s quite a lot of things that can affect number 1, and we’ll go through all these in detail later, but number 1, the cutoff voltage that you choose to use in your circuit or the product you have got number 2, the temperature of the battery, not just the ambient temperature but we’ll go into that the discharge current or the discharge power or whatever you determine the discharge rate, the shelf life of the battery will affect it as well.
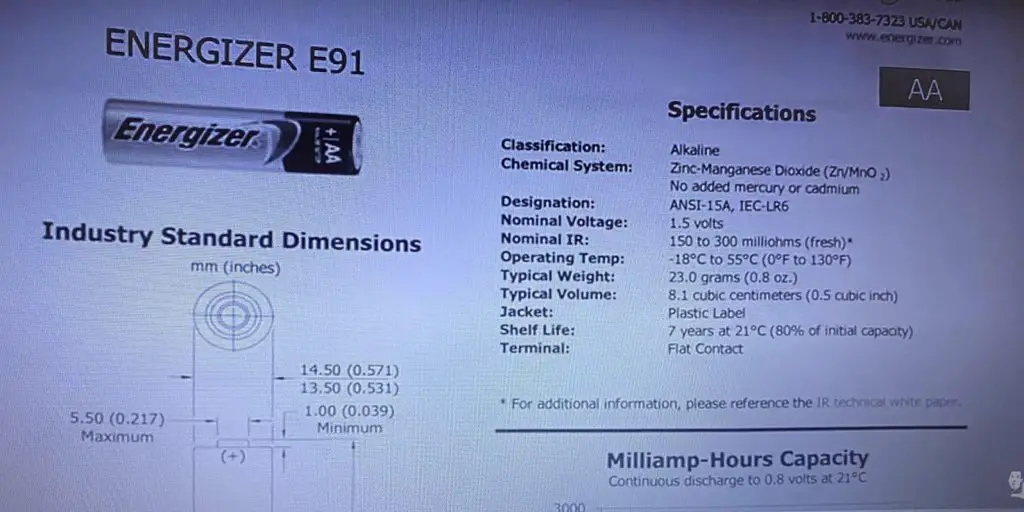
If it’s a two-year-old battery it will have lost some of its initial capacity, and then you’ve got the self-discharge. Some batteries are a lot better than others self just discharged, and that’s tied into shelf life there as well. Hence, look at these, let us take a look at some real datasheets we have got an energiser AA battery here. It is an alkaline AA standard energiser, you know if you have used it and let’s take a look at the effect of the cutout voltage on your actual product. So if you are designing a product, let’s take a look at the discharge, typical discharge curve. If you have to design a product, here is the voltage of the battery now.
If you design your product to cut out at the site or give you a low battery warning error at say 1.1 volts, then look at all this capacity under the curve here that you are throwing away. You are just pissing away all of that battery capacity. Now it gets even worse if you make 1.2 volts, if you cut out at that, you are wasting half of your battery capacity. It’s crazy so a well-designed product will have as low a cut-out voltage as possible. For an alkaline battery that’s about 0.8 volts. a superbly designed product will operate down to 0.8 volts per cell.
When you’re designing your circuit to work off AA or AAA alkaline cells or primary cells these are the voltages that you should design your product to work down to ideal it. If you want to use the most capacity inside this battery that you can then this is what you should do for a single-cell 0.8 folds. As I said because that just drops off like a brick wall down at 0.8 volts there. Therefore, a two-cell design normally 3.0 volts, 1.6 volts is here, is what you want it to work down to 3 cells and for the seller nominal 6-volt system. 3.2 volts down 2.0 and a six-cell system or your standard 9-volt-hour battery like this. Ideally, your product should work down to 4.8 volts and this is why in my product reviews you will see that I measure the arc, the cutout voltage of the battery so for multimeters working from this 9-volt battery and its cutout voltages, you know 6.5 or 7.0 volts. As some of them are even higher, then they are just pissing away a ton of capacity in the battery.
One of the big things that affect batteries, particularly alkaline cells, is the temperature, not just the ambient temperature but the temperature of the cell as well and in particular low temperatures. We checked the energiser L 91. It’s a AA battery, but it is one of these lithium batteries, it is a lithium-ion disulfide battery, and you have probably heard how great they are? and how they work at low temperatures? and how do they work at higher discharged currents? and all that, but they have actually got some well, and they have got some charts down here for the temperature and let’s take a look at them where they compared this lithium to a standard alkaline cell.
Now these dark bars here represent the lithium battery, and these and the other one there represents the alkaline and as you can see this has a cold. The temperature here is zero degrees C, and this is at room temperature 21 degrees C over here now; as you can see at room temperature at different discharged currents. You can see how the lithium outperforms the alkaline cell, but the exciting thing to note is that; notice the level of the alkaline cells here, and now it’s at room temperature 21 degrees. Once you take them down to zero degrees they are dropped and they have more than halved, so you’re losing a lot of your capacity especially at the high discharge temperature. Now that is pretty obvious when you take a look at a reason for it is obvious if you take a look at a temperature curve here basically the series resistance in the cell versus temperature on the x-axis here, this is positive temperature; this is 40 degrees up here and minus 40 degrees down here. You will see that as the temperature decreases, the series resistance in the cell increases.
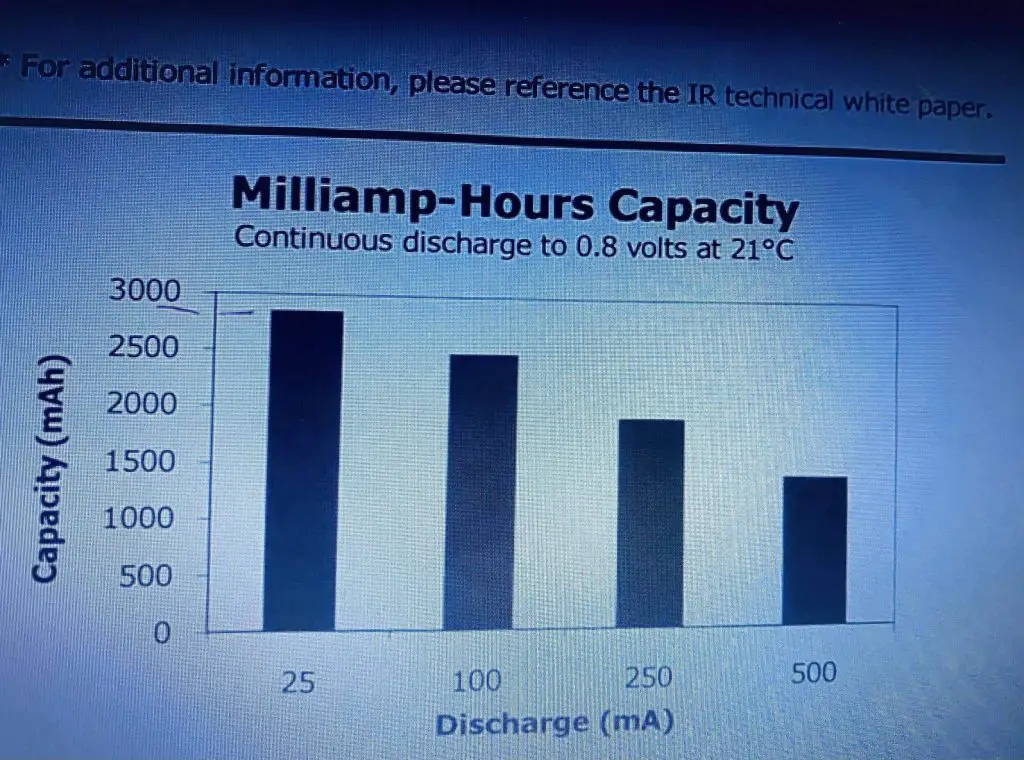
So you are going to lose capacity due to your IR increasing and of course, a discharge current affects the capacity greatly as well now as you can see we have got the capacity of the battery in milliamp-hours up here from 0 to 3000. The different discharge currents are 25 milliamps up to 500 milliamps. As you can see at 25 milliamps relatively low discharge current for an AA battery. Its capacity is a nominal say 2800 milliamp-hours, and that is the figure that you typically hear about. Therefore, if you get 500 milliamps then the capacity is looking it’s only about 1200 milliamp-hours a big difference, and if you take a look at shelf life here then you can see that after it has got after seven years from the data manufacturer at 21 degrees C, it is only going to have 80% of its initial capacity.
Now that those figures are not often true it depends on the actual menu from the manufacturing quality of this particular batch of it, you can’t always rely on that figure strictly, so take it with a grain of salt. Now comes the big reason why batteries have a discharge?
The characteristic curve that they do and why it’s not ideal is because of the internal resistance of the battery now the internal resistance or the IR sometimes called the ESR of the battery. The equivalency is resistance is made up of two different types of resistances in series;
- One is the electrical resistance and that is like the internal metal contacts, the construction of the battery.
- Another part is the ionic resistance or the electrochemical reaction inside the battery. And this is to do with the electrolyte, the conductivity of the electrolyte, the surface area of the electrode, and the polarisation and that sort of stuff and this one act is much slower than the electrical resistance, will always be there bang straight on.
Therefore, the ionic resistance has a bit of lag, so we will only show up under pulse conditions as you can see, this is the datasheet for a cr 2032 Coin Cell battery which all are familiar with.
It just happens to have a pulse characteristic graph-like. Which is the method used to measure these two different types of resistances. When you apply a pulse by, there is the battery voltage in volts, and time, a pulse bang here, then it drops down suddenly, and that part there the very steep part is the electrical resistance than the ionic, then after some time, the ionic resistance will kick in and go like that; it’ll take some time, but it’ll eventually settle down to a fixed value and the total Internal Resistance, that you see in the graphs.
This is a graph of the IR versus the characteristic discharge curve. You’ll see that the IR is just one particular. The value specifies up here in the datasheet is that typical IR will start at 1000 and increase to 40 ohms at the end of its life. Now what I love about this particular discharge characteristic graph, how the IR increases at the same rate as the characteristic discharge curve decreases. It matches the discharge characteristic curve. The battery capacity, the load type is all-important, there are three different types of loads, and on a particular datasheet for the battery.
Table of Contents
Types of Loads
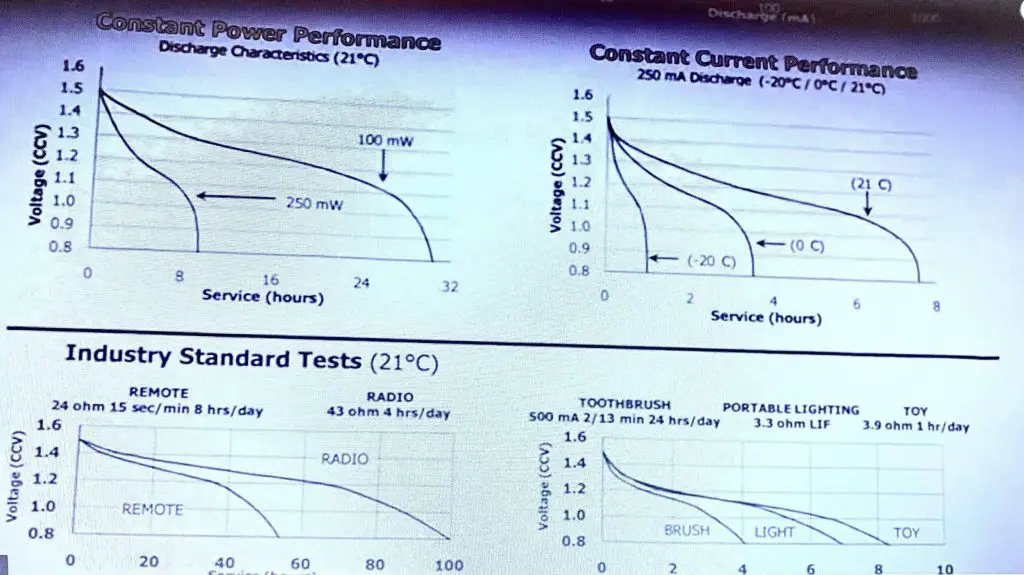
- The first type, most common is the constant current load type.
- The second type is the constant resistance type and as it says it’s resistance so to test that, they put, you know, a 10 a.m. or 100-ohm resistor across the battery, and most circuits are not going to be constant resistance, Are they? you know they are going to be a constant current.
- The third type, which is constant power, is probably the most accurate one for most circuits you’re going to design most products which is why the watt, our capacity because watt-hours is power. The constant power graph might be more important for you if you’ve got a D/C to D/C converter circuit driving your particular circuit, then you probably might want to look at the constant power graph instead of the constant current or constant resistance characteristic graphs, if you feed the voltage back to a microcontroller, and you control the input if you feed via a DAC so if you use an intelligent micro in there you can actually by doing some simple Ohm’s law calculations on the fly and actually changing this as the thing discharges you can generate a constant resistance or a constant power in this load. Therefore, this is a pretty handy way to measure battery capacity.
- The fourth type of load is the pulse load and the pulse load can actually apply to any three of these types; constant current, constant resistance and constant power, and it just means that they will typically have if this is a current up here then they might actually pulse it like this, they might have a steady low current down here and pulse it to a high current periodically.
How do you calculate the battery life?
Your particular product, as I said you have got to pick the type of load which is typical of your product: constant current power, constant resistance, really accurate estimate of the battery life for your product based on just the characteristic curves in the datasheet.
If batteries are 2000 milliamp-hours and you know it’s going to roughly draw 50 milliamps plus minus 25; constant current and you can just do the simple figures and calculate it’s going to have X amount of Y, you might drop it down by 30 percentile and calculate it. And then drop it back by 30 per cent, and well by circuits got a D/C to D/C converter, and it’s delivering constant power into my product. So because the efficiency curve doesn’t drop off too much, you can say that there’s a continuous input power from the battery.
Cheat Sheet
Quick summary or a cheat sheet of what battery capacity is?
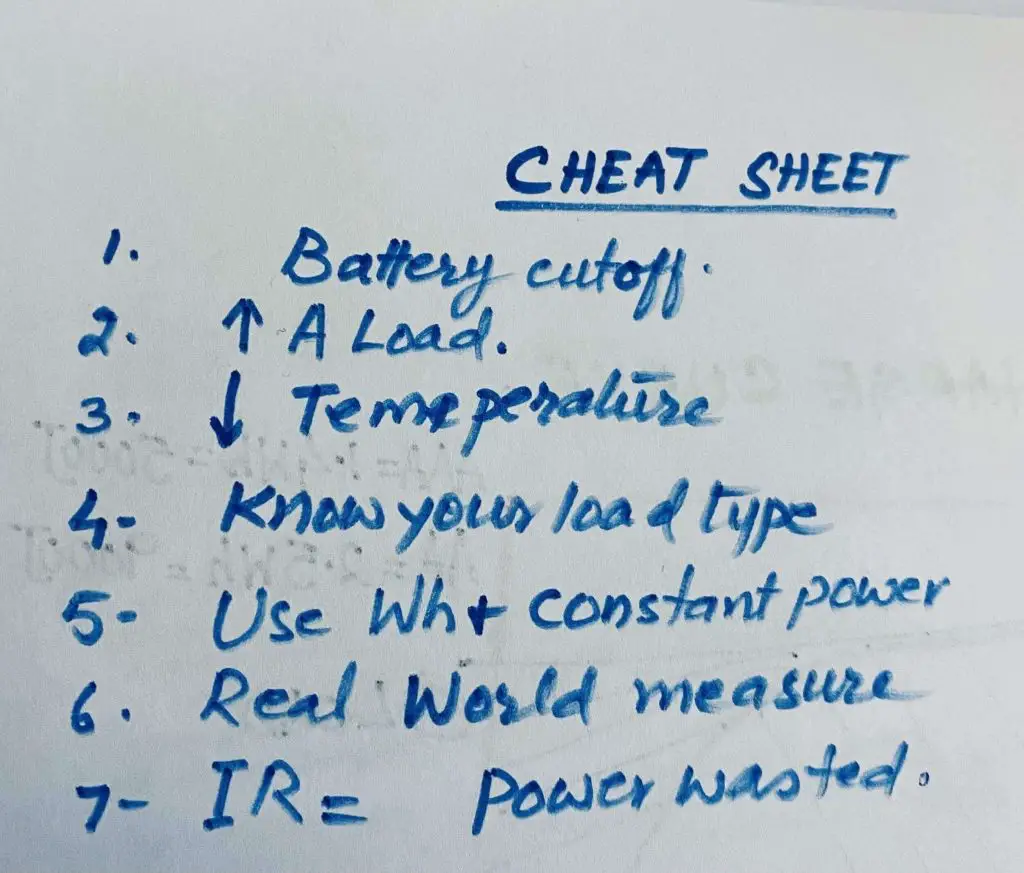
- Number 1: it’s all about the battery cutoff voltage. There is absolutely no point specifying the capacity of a battery if you don’t know what the cutoff is, if you don’t identify or know what the cutoff voltage is.
- Number 2: if you increase the current or increase the load current, you decrease the battery’s overall capacity due to IR.
- Number 3: If you decrease the temperature, you reduce the capacity and remember that it’s the cell’s temperature, not necessarily the ambient temperature. Because the cell can be heated up due to internal resistance.
- Number 4: you’ve got to know your load type, that is your constant current power, constant resistance. Choose the one that’s most appropriate for your particular product when you’re dealing with the graphs, and if you’re serious.
- Number 5: use watt plus constant power because true watt-hour, that is the true capacity of the battery’s milliamp-hours is a bit okay, and the only way to measure true capacity and battery life in your particular product is to measure it in your circuit.
- Number 6: this real-world Tess, and I are is everything it’s all about the internal resistance of the battery, and that means power wasted in your product just pissed away because you’ve got this excess current if you try and draw too much current from a AA battery if you try and draw 2.0 amps out of this thing or 4.0 amps or 5.0 amps it is just not going to do it.
- Number 7: because of the internal resistance it’s going to heat up, it’s going to have a short life, and your characteristic curves aren’t worth squatting. Now no talk about battery capacity won’t be complete without mentioning it, a relatively obscure law which not very often used a lot of people wouldn’t have even heard of it you may come across it’s worth mentioning briefly Peukert’s law.
Peukert’s Law
It is the reduction in capacity at higher currents as we’ve seen and discussed in the characteristic curves and all the rest of it is okay. It’s a more complex formula than this is a simplified version T=C / I*k
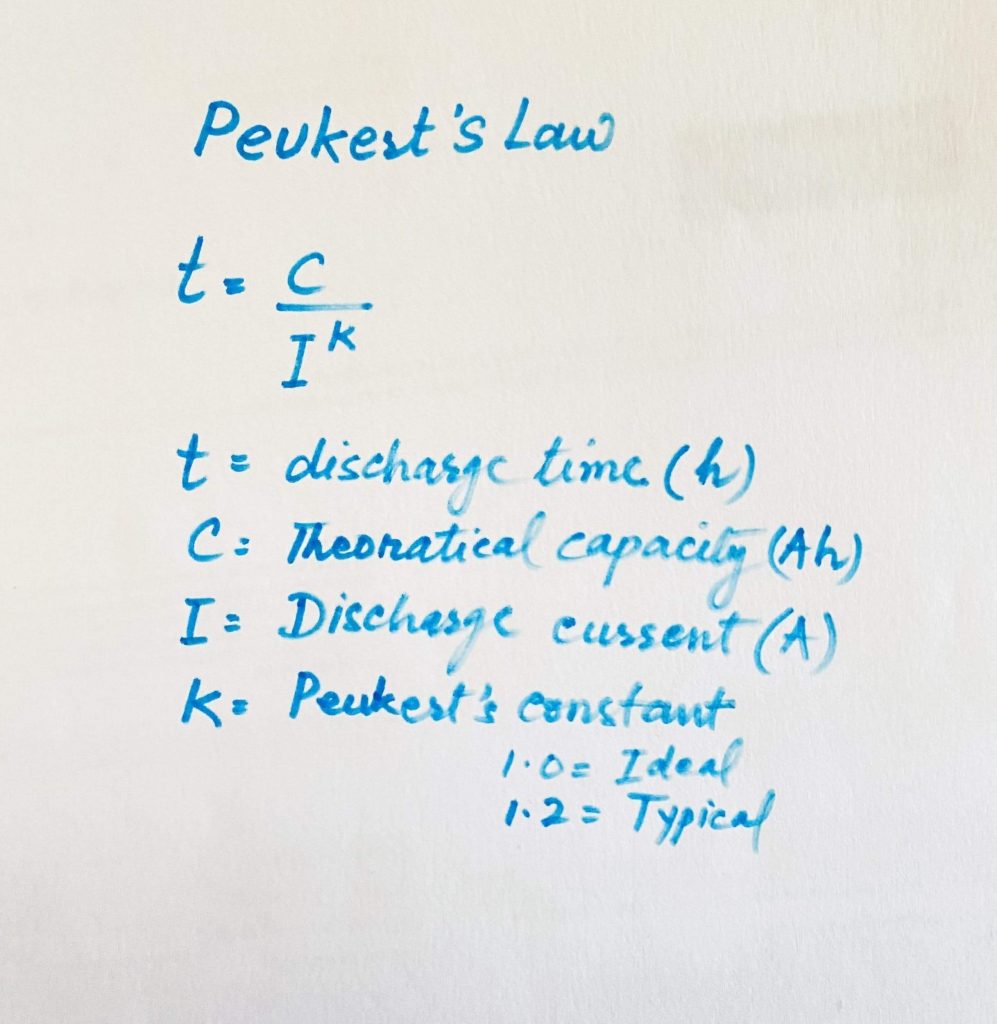
(t, equals C, upon I to the power of K) where K, is the curt’s constant, which is an empirically measured value for the battery 1.0 be an ideal 1.2 to use the T, is the discharge time of C, is the theoretical capacity and the I, is the discharge current so as you can see the actual word, the discharge time goes down if K goes up the constant so your nominal you know 1 amp hour battery might drop to 0.8 meows. This is Peurket’s law by which we can easily measure the discharge time.
Conclusion
This article is all about learning all the calculations and reading the bar graphs to calculate the capacity-hours, to calculate the amp-hours, the mAh value, we have learned how watts are used in time; that is watt-hours, and all the factors associated with internal resistance or series resistance, what is the effect of temperature on battery’s life, how to calculate battery cutoff voltages and we have learned the characteristic curves or discharge curves of the battery. And we have discussed learning to do the procedures and the factors involved in decreasing a battery’s life.
I hope our readers have learned the statistics values of batteries in terms of their use and it’s storage in certain weather conditions and handlings in workplaces. Hence a guide to know the battery’s life.


")